
Date
Mar 15, 2024
Client Name
Cerbrec
Services
UI/UX Design
Project Overview
Cerbrec is a platform designed to simplify and enhance the development, customization, and visualization of AI models. It leverages a graphical deep learning framework to provide users with a comprehensive tool for building, inspecting, and customizing AI models. The project aimed to redesign the website to improve user experience, increase engagement, and better communicate the platform's capabilities.
Identified Problems
User Feedback
The welcome screen is cluttered and the title bar on the welcome window appears unpolished.

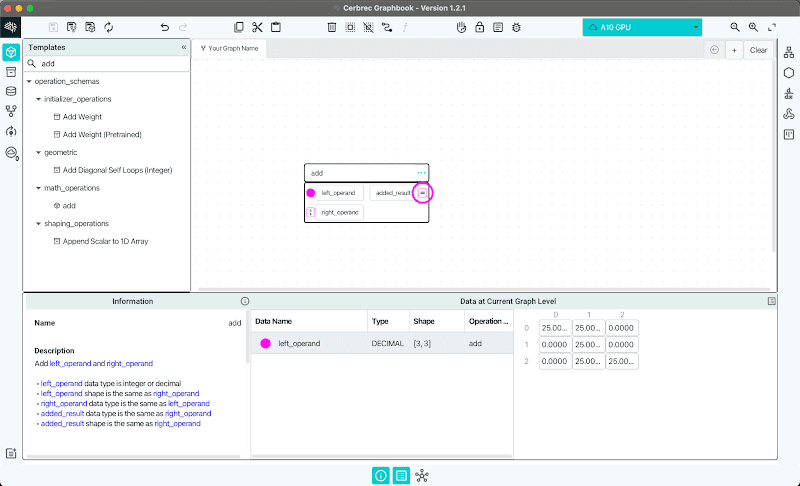
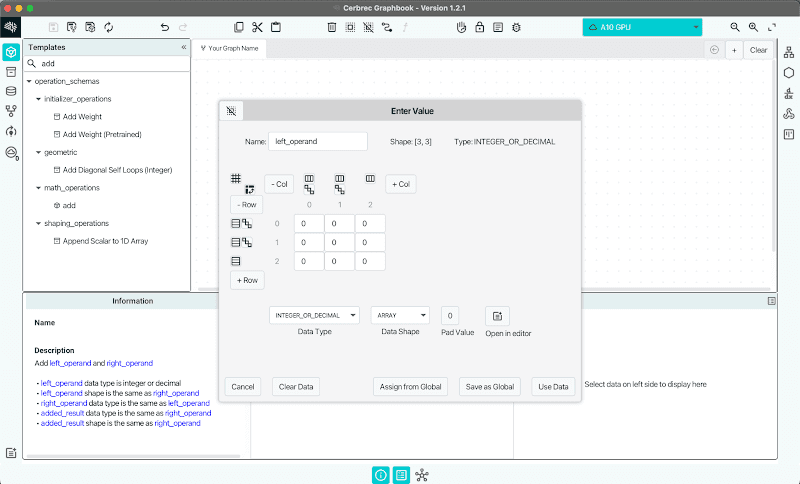
Users prefer to enter array data as text rather than using the spreadsheet builder, which needs significant UI/UX improvements. Involves too many steps, making it tedious for users to input their data.

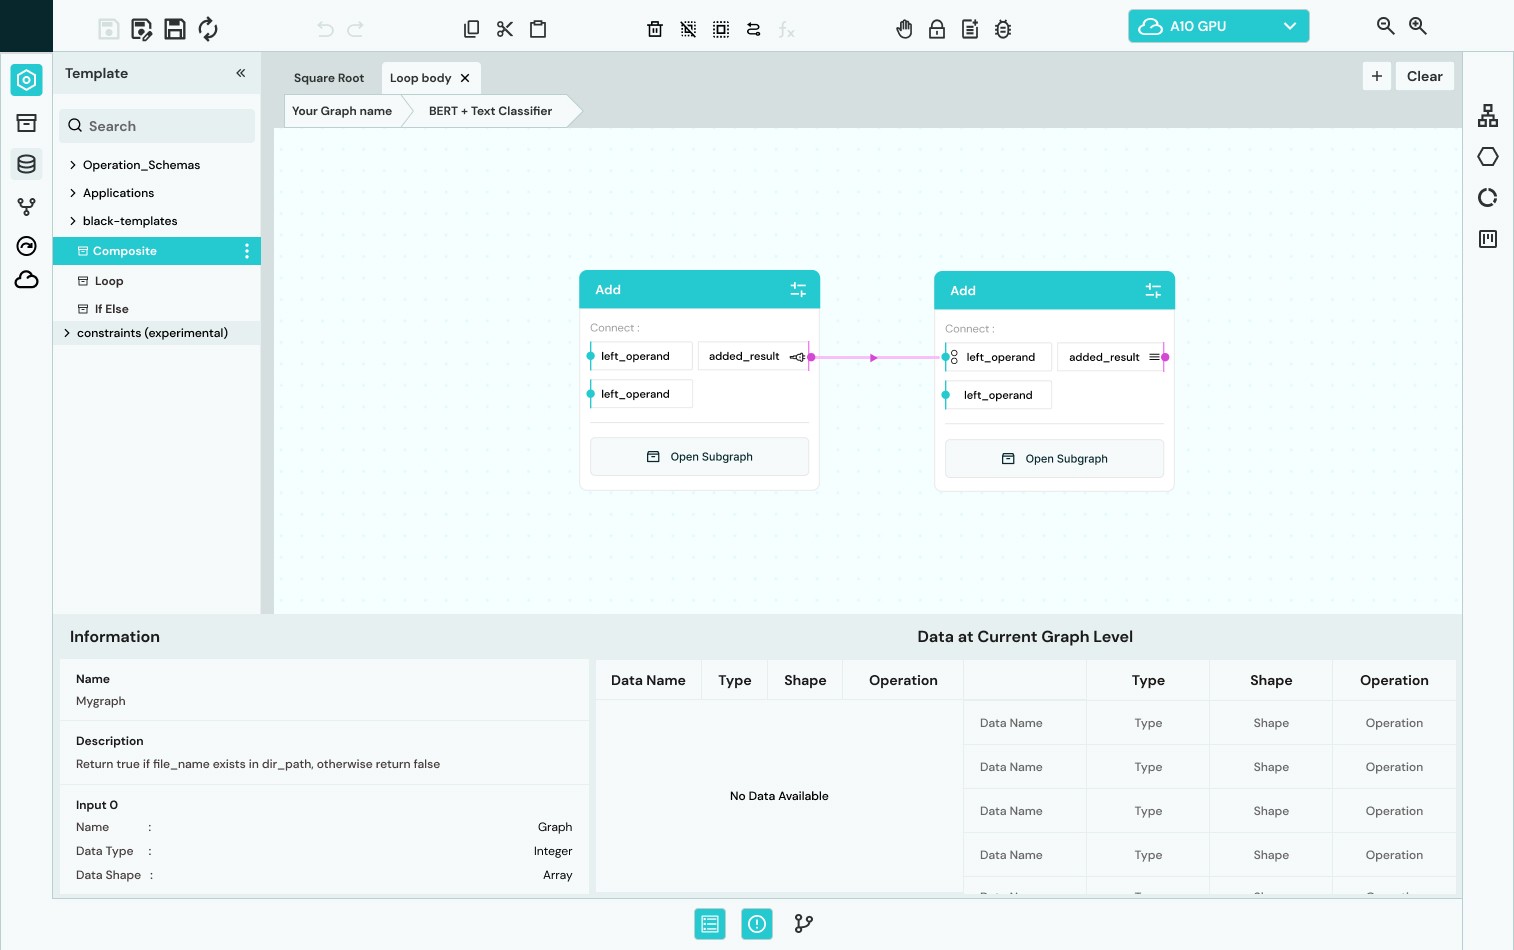
Users are confused about the drag and drop feature and do not realize they can drag elements into the canvas.


The primary challenge was to design a comprehensive website that could:
Effectively communicate the complex and innovative nature of 3D graphene technology.
Highlight the various applications and benefits of 3D graphene.
Ensure the information is accessible and engaging to a broad audience, including potential clients, partners, and researchers.
What I Improve
Welcome Screen
Simplified the layout, organized content logically, and utilized white space effectively.
Redesigned the title bar to ensure consistency with the interface.

Spreadsheet Building Mechanism and Data Entry Process for Graphs
Enabled users to enter array data as text directly, addressing their preference over using the spreadsheet builder.
Enhanced the spreadsheet builder with significant UI/UX improvements to make it more intuitive and user-friendly.
Introduced a step-by-step wizard for data entry in graphs, reducing the number of steps and making data input less tedious.
Provided pre-defined templates, default values, and enabled inline editing directly within the graph interface.
3. Drag and Drop Functionality
Implemented a modal with instructions in the graph field area.
Provided guidance on drag and drop functionality and offered access to an onboarding tutorial.